New Stats on Your Dashboard
We're adding more stats to your Writing Analytics dashboard. Find out how often you hit your goals, when you're the most productive during the day and more.
The Sessions Section
The new Sessions section aggregates all data from your writing sessions. You'll find it right under Productivity on your dashboard in Writing Analytics.
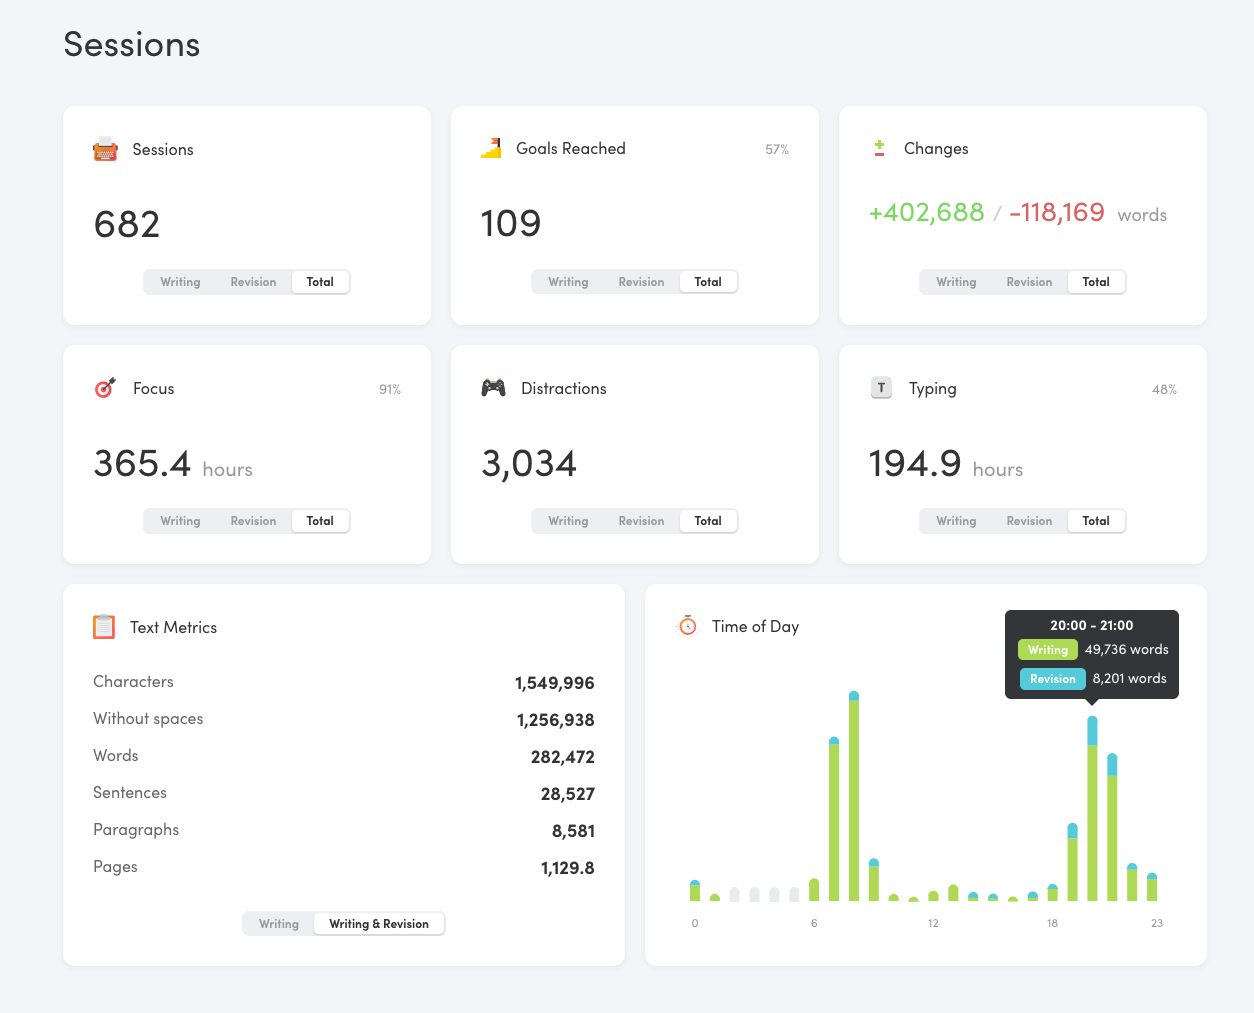
How often do you hit the goals that you set for yourself? How focused are you when you work? How many words do you write and delete? When are you the most productive during the day? Your dashboard has the answer.
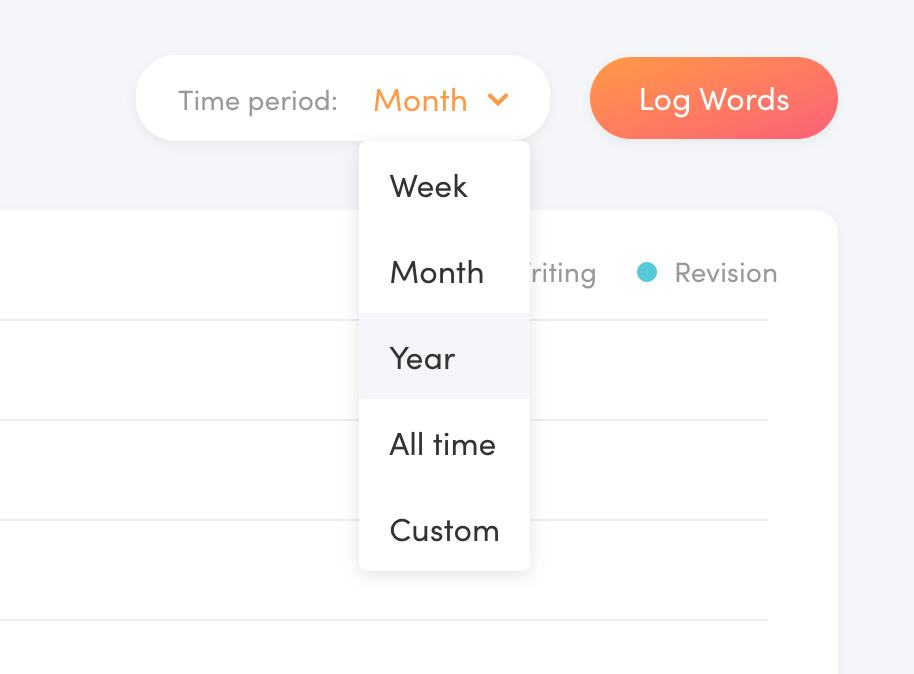
Selecting a Time Period
By default, the dashboard shows your data from the past month. Use the time period selector at the top of the dashboard to modify the date range.
Sessions
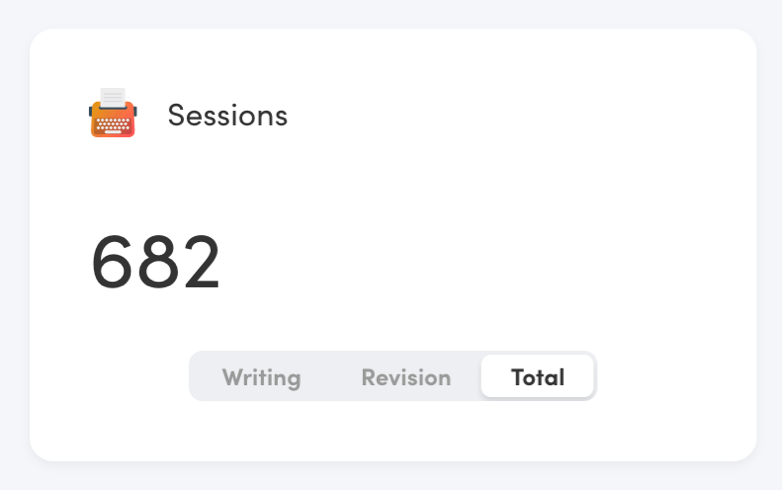
The first card shows the total number of sessions you completed. Use the switch at the bottom of the card to see the total or just writing or revision sessions.
Goals
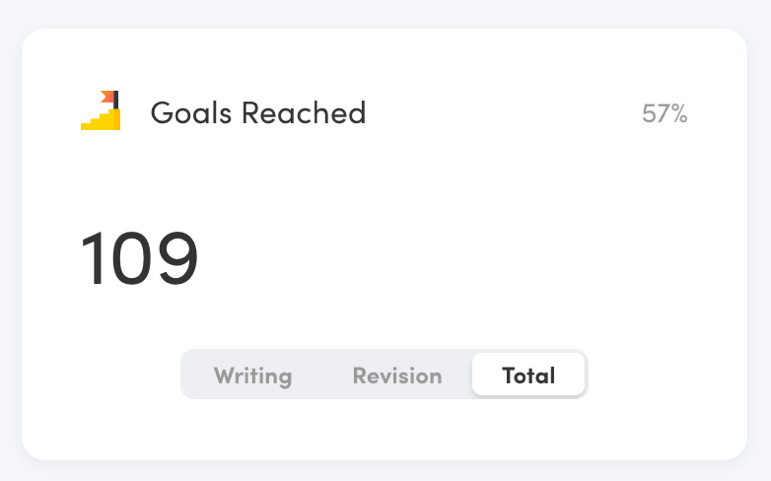
The second card shows the number of times you reached your goal during a session. This includes both word and time goals.
The percentage in the top right corner shows the percentage of goals completed. For example, 30% means you reached 3 out of 10 goals that you set.
Changes
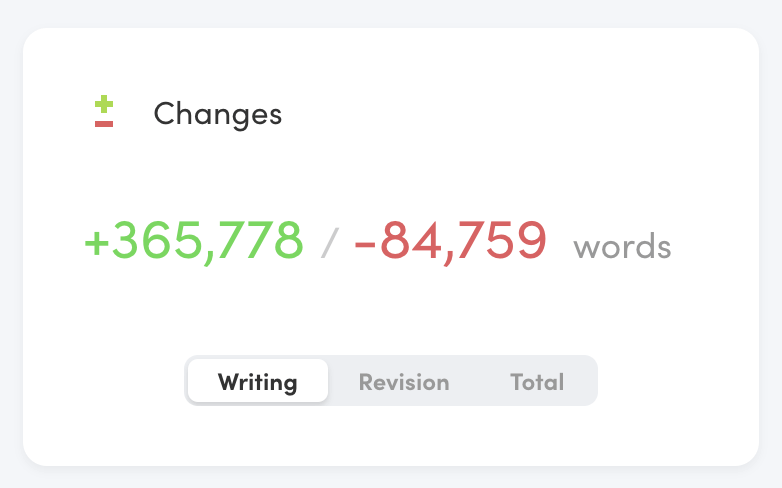
The third card in the first row shows all the changes logged during your sessions. The two numbers represent the words you added and deleted while working on your drafts.
Focus
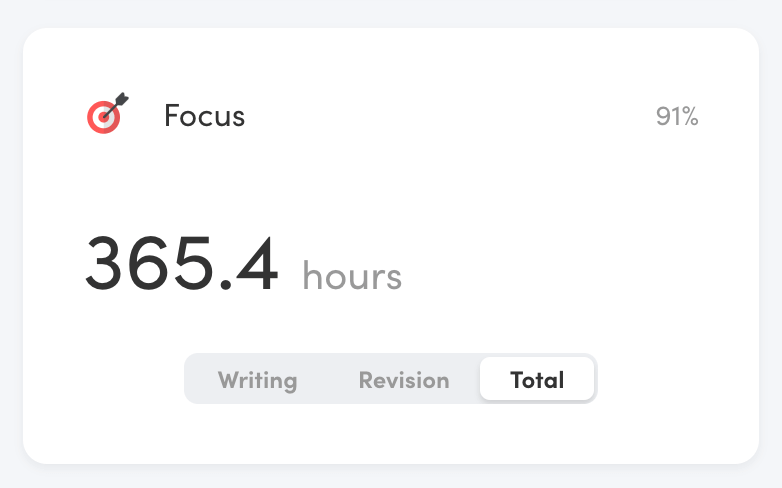
The Focus card shows you how much time you spend focusing on your writing during your writing sessions. The number in the top right corner tells you what percentage of your sessions you were focused on.
Distractions
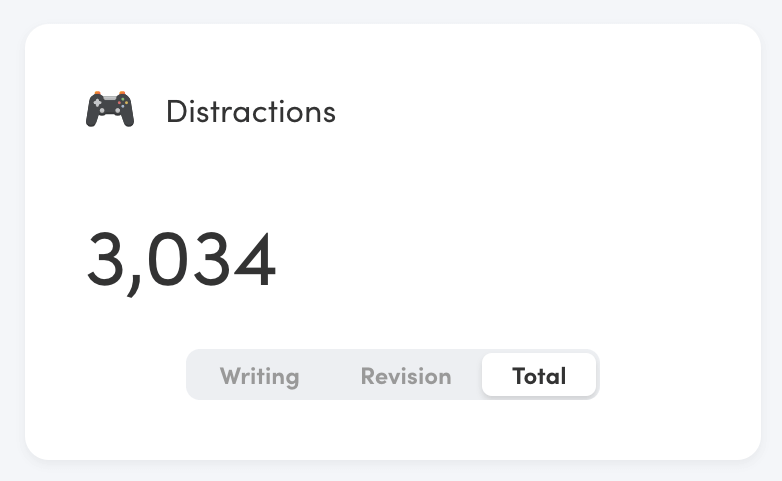
The next card tells you how many times you were distracted and moved away from the editor when working.
Typing
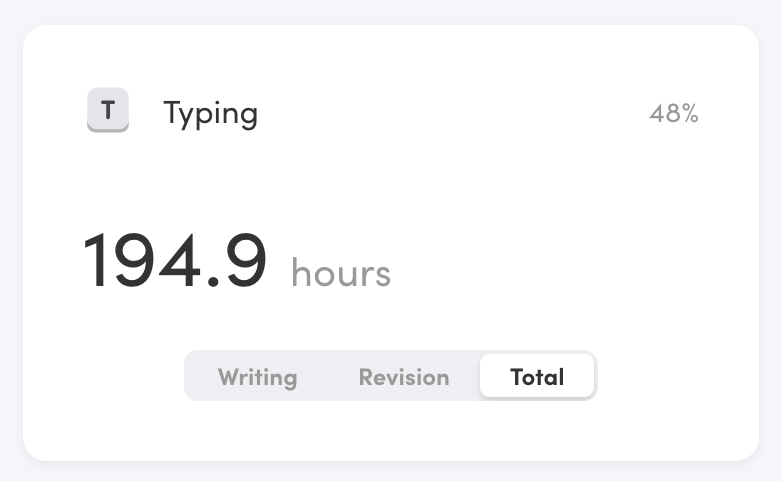
The last card in the second row adds up all the time you've spent typing during your sessions. The number in the top right corner tells you what percentage of each session you spend actually typing.
Text Metrics
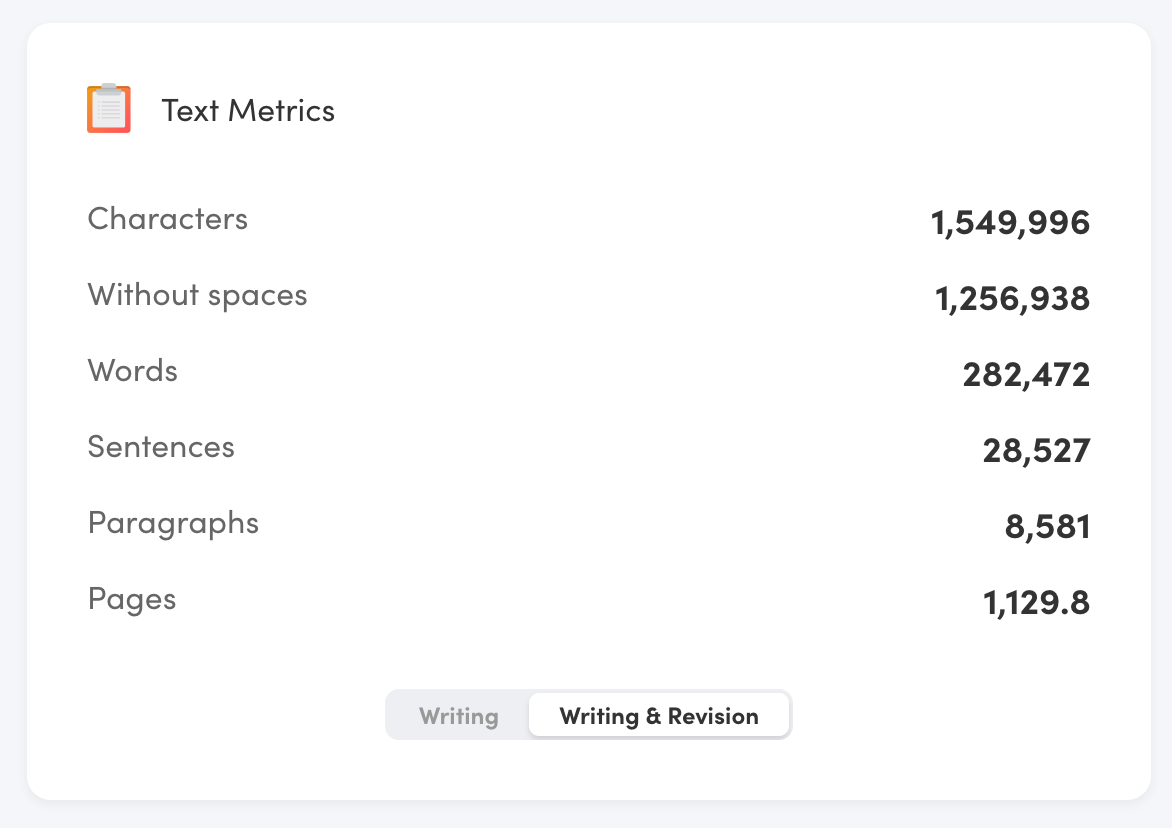
The Text Metrics card at the bottom has the metrics from all your drafts in Writing Analytics. You can see how many pages, paragraphs, sentences, words and even the number of characters you wrote.
When you switch to the Writing & Revision tab, you'll see the figures adjusted with revision data. If you tend to overwrite when drafting and cut a lot when editing, the adjusted figures may be lower.
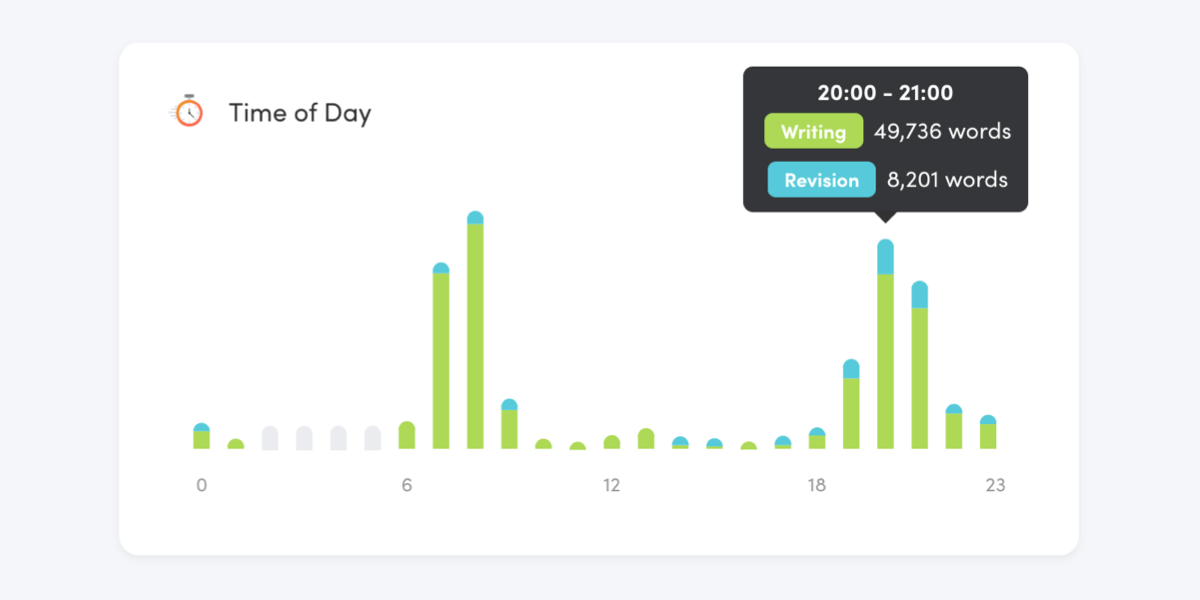
Time of Day
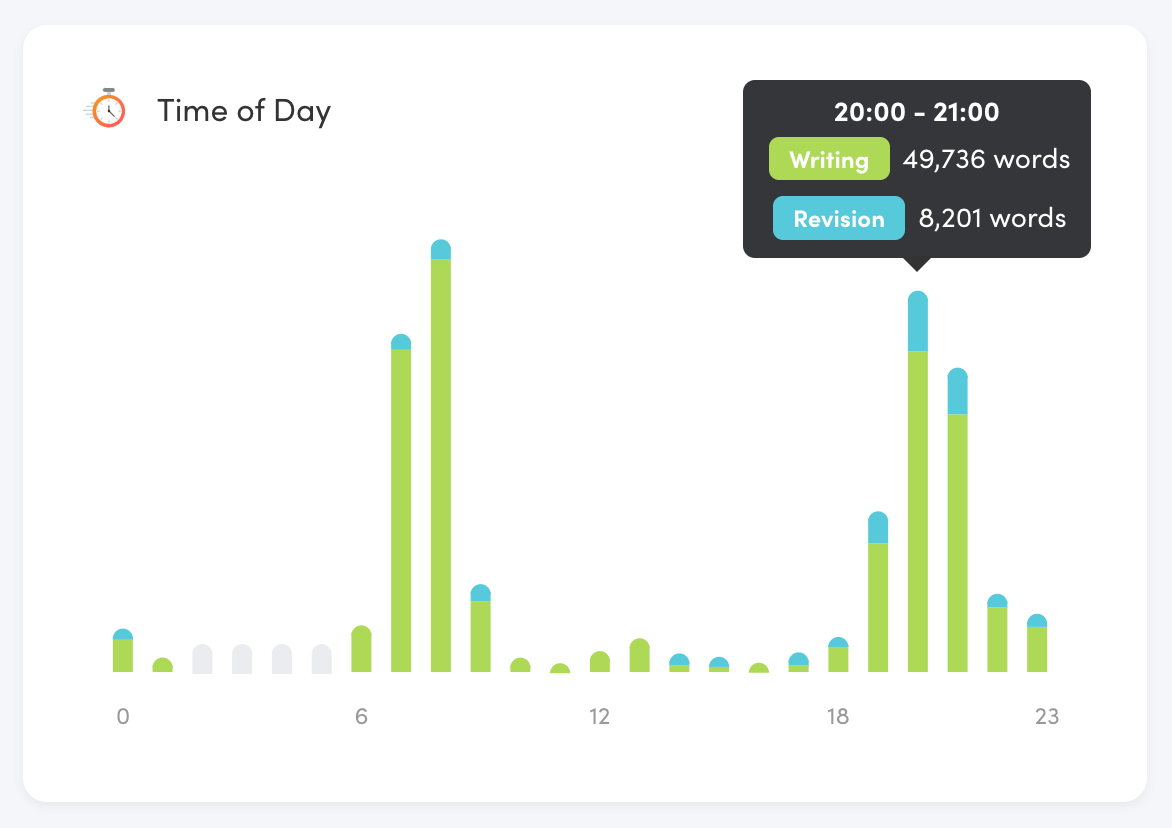
The Time of Day card shows you how an hour-by-hour breakdown of your productivity during the day. Each bar represents the number of words you wrote and revised at that hour. Hover over the chart to see the exact figures.
Final Thoughts
We're always working to make Writing Analytics better at helping writers put words on the page. What would you like to see us build next?
Send us an email or tweet at @writinglytics. We'd love to hear your thoughts!
Not a Writing Analytics user yet? Start your 14-day free trial today!